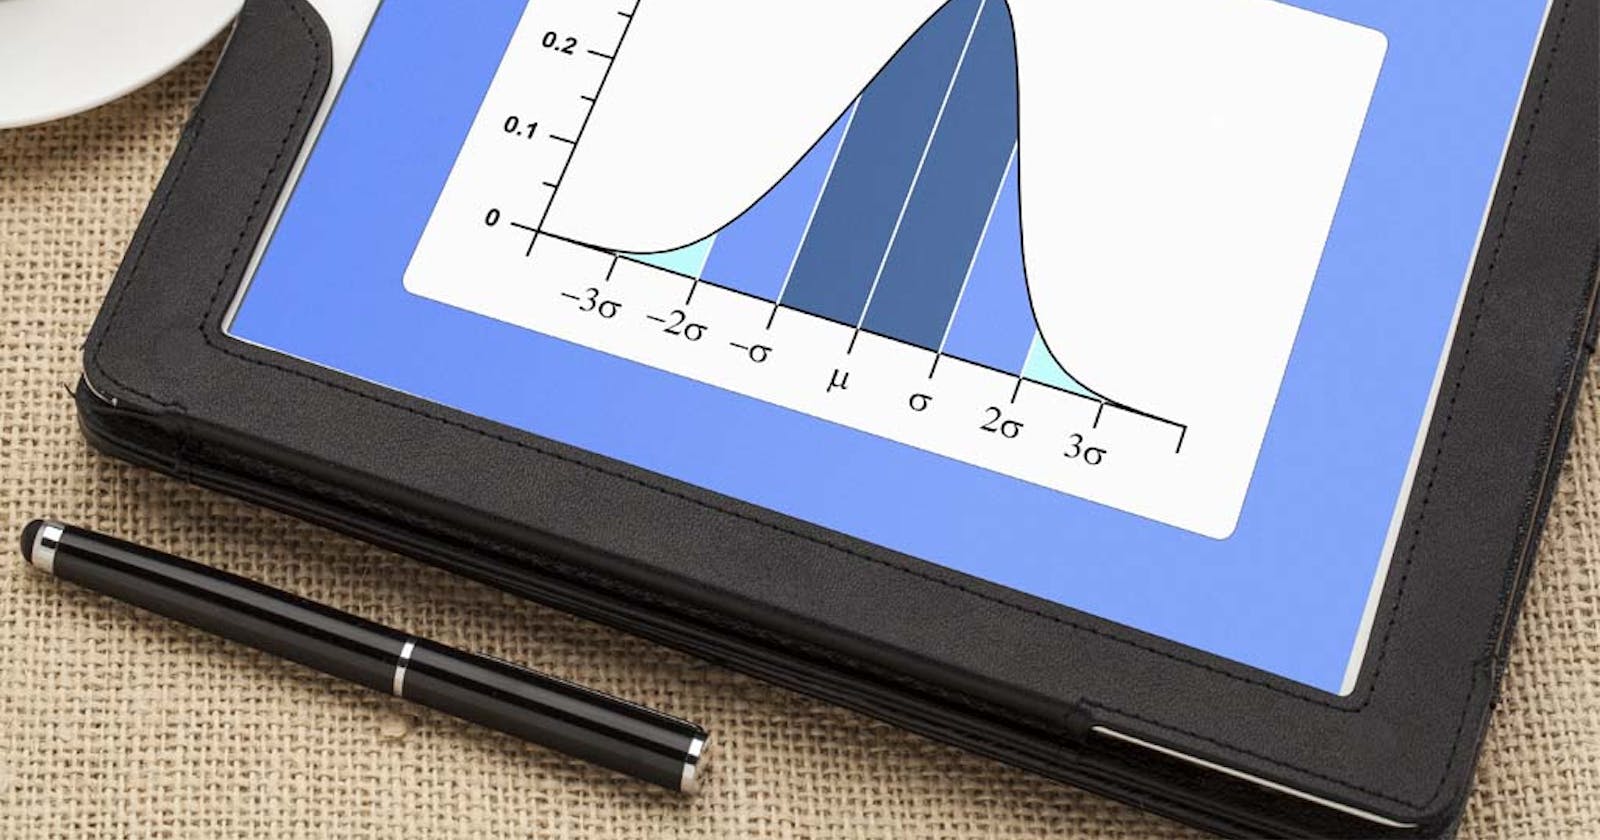
Standard deviation is a statistical term that measures the dispersion of data points around the mean. In other words, it tells you how spread out the data is. The higher the standard deviation, the more spread out the data is. The lower the standard deviation, the more clustered the data is around the mean.
What is Standard Deviation?
Standard deviation is a statistical measure of how to spread out data. It is calculated as the square root of the variance. The variance is the average of the squared differences from the mean. Standard deviation is used to measure how much variation there is in a data set. A low standard deviation means that most of the data points are close to the mean, while a high standard deviation means that the data points are more spread out.
Standard deviation can be used to find outliers in data sets. An outlier is a data point that is far from the rest of the data. Outliers can be caused by errors in measurement or they can be real differences. Standard deviation can also be used to compare two data sets to see if they are similar or if one set has more variation than the other.
How to Calculate Standard Deviation
Standard deviation is a statistical measure of how to spread out data. It is calculated by taking the square root of the variance. The variance is calculated by taking the average of the squared difference from the mean.
To calculatestandard deviation, first, find the mean and then subtract the mean from each data point to find the deviation. Next, square each deviation. Finally, take the average of all of the squared deviations and then take the square root.
The standard deviation can be used to find how much variation there is in a data set. It is also used to find outliers in data sets. Data points that are more than three standard deviations from the mean are considered outliers.
To calculate standard deviation by hand, use this formula:
σ = √Σ(x-μ)^2/N
where σ is the standard deviation, x is each data point, μ is the mean, and N is the number of data
if you want to know more you can visit turito.com/learn/math/standard-deviation

